Population:
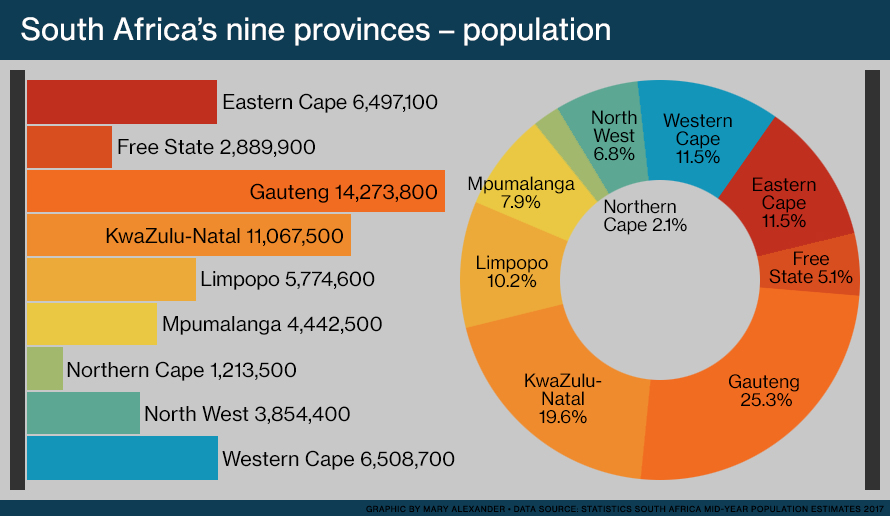
The Census 2022 results show that the population of South Africa was 62 million in 2022, increasing from 51,7 million in 2011. This represents an average annual growth rate of 1,8% between the two periods, which is the largest since 1996. Gauteng remained the province with the highest population (15 million), while Northern Cape has the smallest population at 1,3 million. About 56% of the country’s population lives in three provinces, namely Gauteng, KwaZulu-Natal and the Western Cape. The Western Cape has moved from being the 5th-largest province in terms of population size in 1996 to being the 3rd largest in 2022.
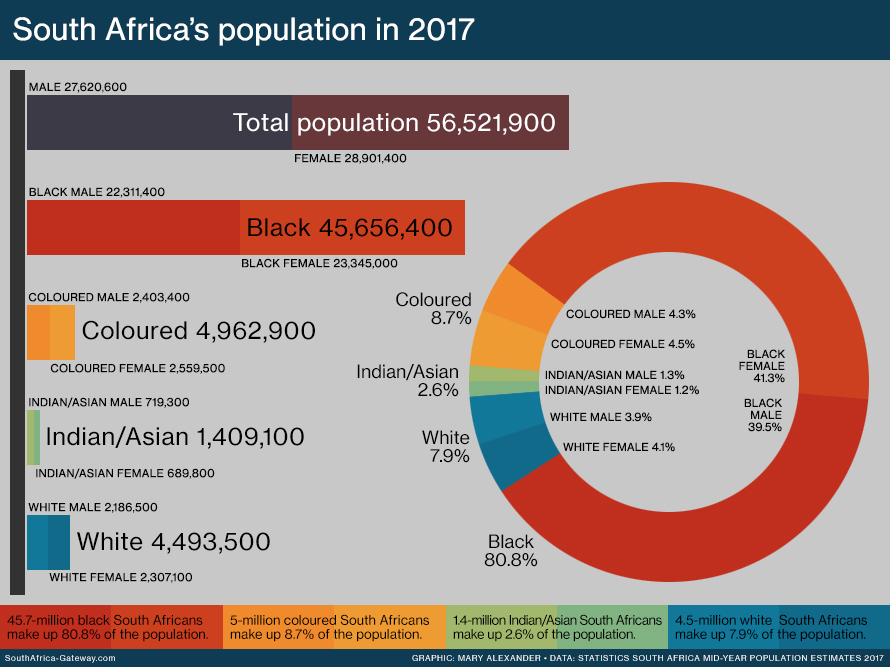
Black Africans remain the dominant population group (81,4%), followed by coloureds at 8,2%, whites at 7,3% and Indians/Asians at 2,7%. There has been a steady decline in the proportion of the white population, from 11% in 1996 to 7,3% in 2022.
- Estimated population: 61-62 million (Worldometer, July 2024)
- Positioned as the 24th most populous country globally (Worldometer, July 2024)
- Population density: Around 50 people per square kilometer (Worldometer, July 2024)
Population of the Provinces
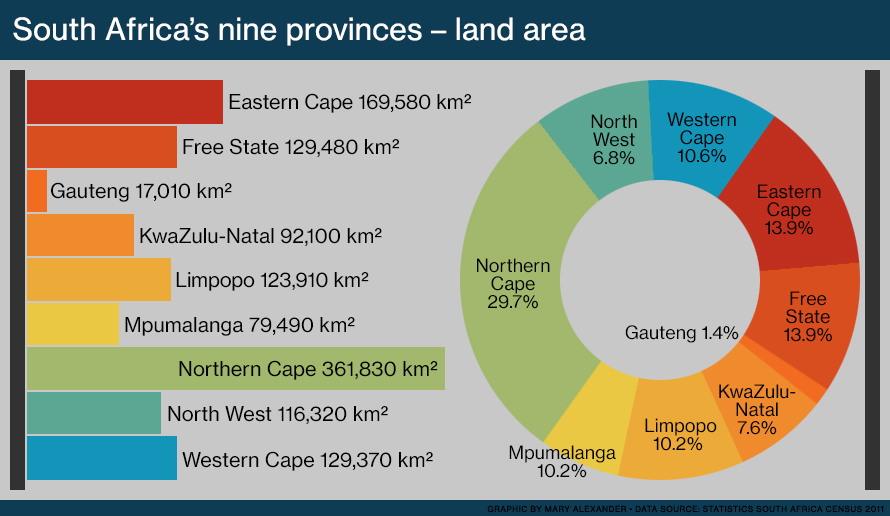
Land Area per Province
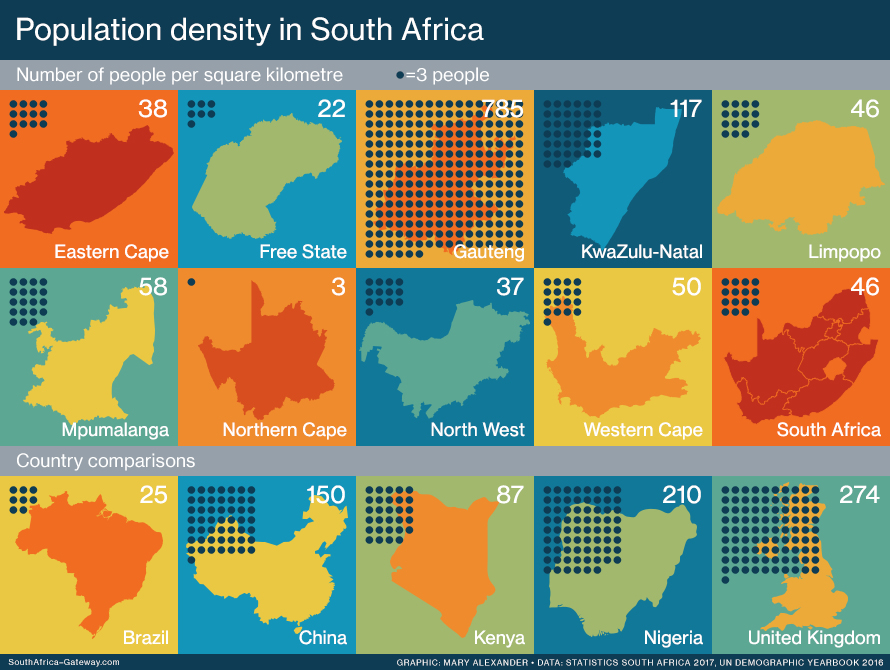
Population density
South Africa’s population density is 46 people per square kilometre.
In the provinces, differences in size and population mean different population densities. Gauteng, small but populous, has an average of 785 people for every square kilometre. KwaZulu-Natal has 117 people per square kilometre. The empty Northern Cape has a population density of only three people for each square kilometre.
Life, death and HIV
In 2017, South Africans’ life expectancy at birth is an estimated 64 years – 66.7 years for females and 61.2 years for males. This is up from around 55 years in 2002, before any serious effort to tackle the HIV and Aids epidemic began.
Infant mortality (babies who die in their first year of birth) is at an estimated 32.8 deaths for every 1,000 live births. The under-five mortality rate is 42.4 deaths per 1,000 live births. These rates are down from a peak in 2002, when the infant mortality rate was 48.1 and the mortality rate for under-fives at 71.3.
Statistics South Africa estimates the country’s overall HIV prevalence rate at about 12.6%. In 2017, the total number of people living with HIV was some 7-million. About 18% of adults aged 15 to 49 are HIV-positive.
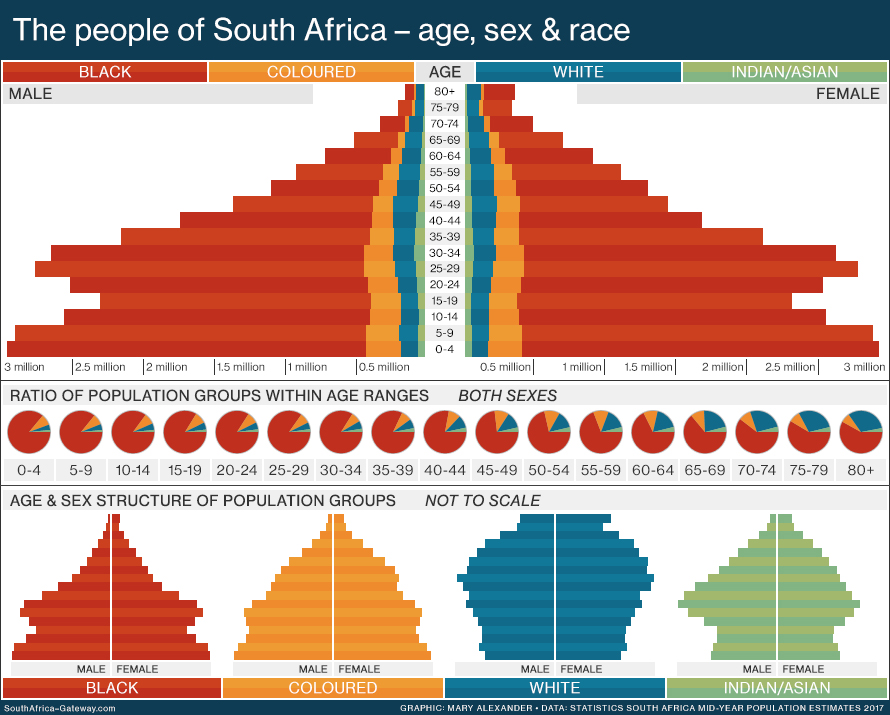
Age structure
Some 16.7-million South Africans are 15 or younger – nearly a third of the population. The provinces with the highest proportion of children are Limpopo, where 35.2% of the population is under 15, the Eastern Cape (33.6%) and KwaZulu-Natal (31.9%).
Around 15.7-million people are 15 to 29 years old, or 26.8% of the total population. A further 12.8 million are aged 30 to 44 (22.8%), and 7.1 million aged 45 to 60 (12.7%).
South Africans aged 60 years or older number 4.6-million people, making up 8.1% of the total. The country’s older population has steadily increased over the last few decades as South Africans live longer. The provinces with the highest proportion of people aged 60 or older are the Eastern Cape (9.9%), the Northern Cape (9.8%) and the Western Cape (9.1%).
The Eastern Cape is South Africa’s poorest province with the highest rate of outward migration to other provinces. This leaves it with the highest proportion of both children and the elderly, as working-age people leave for elsewhere to find jobs.
South Africa’s population structure reveals facts of history and continued inequality. While black South Africans are in the majority in every age group, this majority decreases as the age of the population rises. Coloured, Indian and especially white South Africans tend to live longer.
The dent in South Africa’s population pyramid at ages 10 to 24 may be a legacy of South Africa’s Aids epidemic of the 1990s and 2000s.
Migration
South Africans migrate away from poverty to where the jobs are. They move from poorer provinces to the richer ones, and from rural areas to the cities.
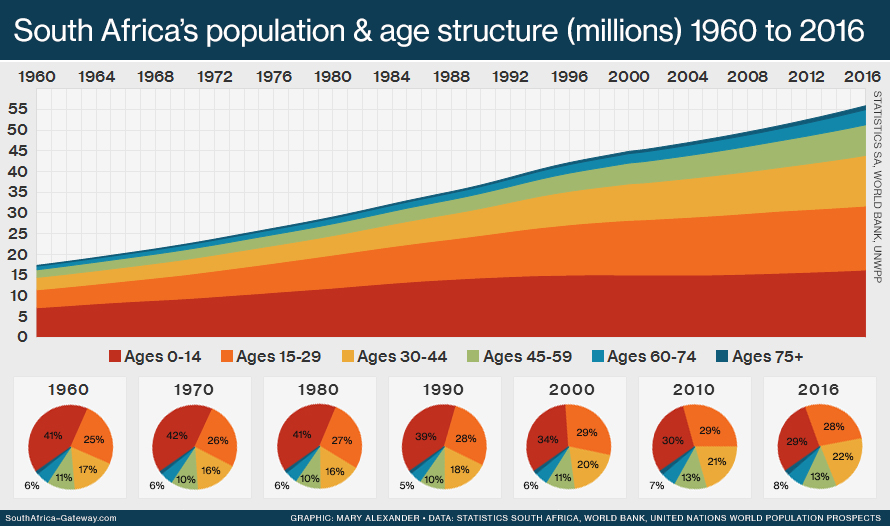
Trends in South Africa’s population from 1960
Age structure
There’s a lot of talk of South Africa’s population being dominated by the youth. But as the graphic below shows, we’re less youthful than we have been for decades.
The end of apartheid, better healthcare, widespread social welfare and greater economic opportunities all mean South Africans are now able to live longer lives – reducing the proportion of children and youth in our total population. See the actual figures for selected years.
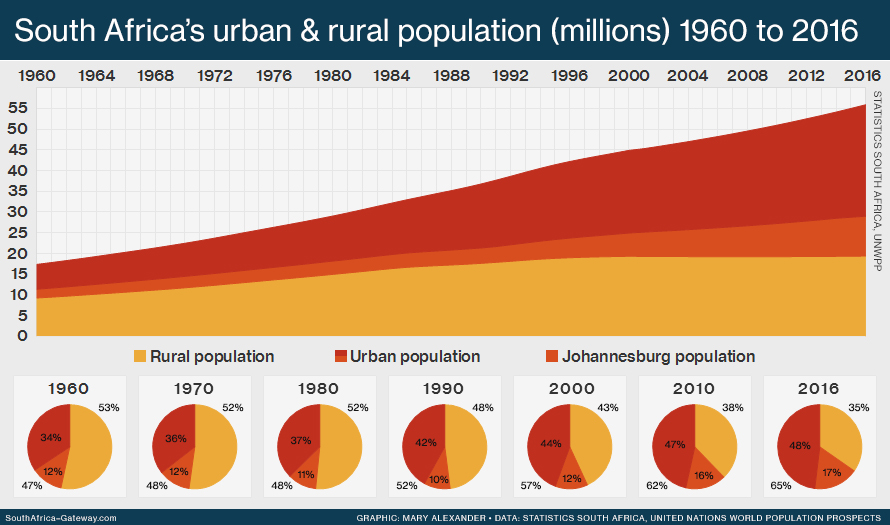
Urbanisation
From 1960 to the late 1980s, apartheid laws kept families and communities in poor rural areas. Young men alone were allowed to move to the cities, where their labour was valuable.After the end of apartheid, from the mid-1990s, urbanisation increased rapidly. In the last 20 years, much of the migration from rural areas has been to Johannesburg, which has been South Africa’s largest city since 1950.
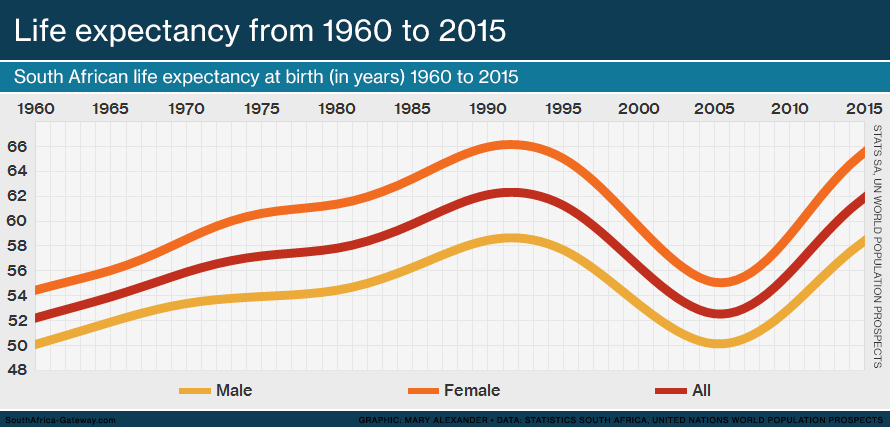
Life expectancy
Charting South Africans’ life expectancy is to track the country’s modern history. In 1960, a time of terrible apartheid abuse, an average newborn child was expected to have a lifespan of only 52 years – 50 years for boys. In 2015, life expectancy was 62 years. In between, life expectancy has risen and fallen. The most severe drop was during the crisis of the HIV and Aids epidemic, from 1995 to 2005. In 2005, life expectancy was the same as it had been in 1960.
Sources:
- Worldometer: https://www.worldometers.info/world-population/south-africa-population/
- South African Government: https://www.gov.za/about-government/contact-directory/profile
- Statista: https://internal.statista.com/statistics/1116076/total-population-of-south-africa-by-population-group/
- Wikipedia Demographics South Africa